Number of instances in the rss for a past date

Dear RSSAC Caucus, The https://root-servers.org/ shows, for the current day and time (UTC), the total number of instances that compose the root server system. Is there any resource available that shows this number for a particular day in the past ? More specifically, let's say a graph showing the historical evolution of instances count in the rss over time, for example. If such does not exist, will this require first an update of RSSAC002 before make such graph available ? On the same web site (mentioned above), we can see for each RSO the number of sites for the identity they manage, and a clic on a specific site gives the number of instance for that site. However, there is no data directly showing the number of instances for each RSI at once.this In case the subject had already been discussed, my apologies for raising again. -- Prenez soin de vous car chaque jour est une vie. Yazid Akanho Tel: +229 97979910.

If you go to: https://root-servers.org/archives/ You can see the archives per-day from each root server operator. Each YAML/JSON file contains details about all the published instances of each operator on that day. I'm not aware of an existing nice graph but the data is there if you wish to generate such a graph. Kind regards, Colin Petrie On 13-11-2023 21:41, Yazid M. AKANHO wrote:
Dear RSSAC Caucus,
The https://root-servers.org/ <https://root-servers.org/> shows, for the current day and time (UTC), the total number of instances that compose the root server system. Is there any resource available that shows this number for a particular day in the past ? More specifically, let's say a graph showing the historical evolution of instances count in the rss over time, for example.
If such does not exist, will this require first an update of RSSAC002 before make such graph available ? On the same web site (mentioned above), we can see for each RSO the number of sites for the identity they manage, and a clic on a specific site gives the number of instance for that site. However, there is no data directly showing the number of instances for each RSI at once.this
In case the subject had already been discussed, my apologies for raising again.
-- Prenez soin de vous car chaque jour est une vie. Yazid Akanho Tel: +229 97979910.
_______________________________________________ rssac-caucus mailing list rssac-caucus@icann.org https://mm.icann.org/mailman/listinfo/rssac-caucus
_______________________________________________ By submitting your personal data, you consent to the processing of your personal data for purposes of subscribing to this mailing list accordance with the ICANN Privacy Policy (https://www.icann.org/privacy/policy) and the website Terms of Service (https://www.icann.org/privacy/tos). You can visit the Mailman link above to change your membership status or configuration, including unsubscribing, setting digest-style delivery or disabling delivery altogether (e.g., for a vacation), and so on.

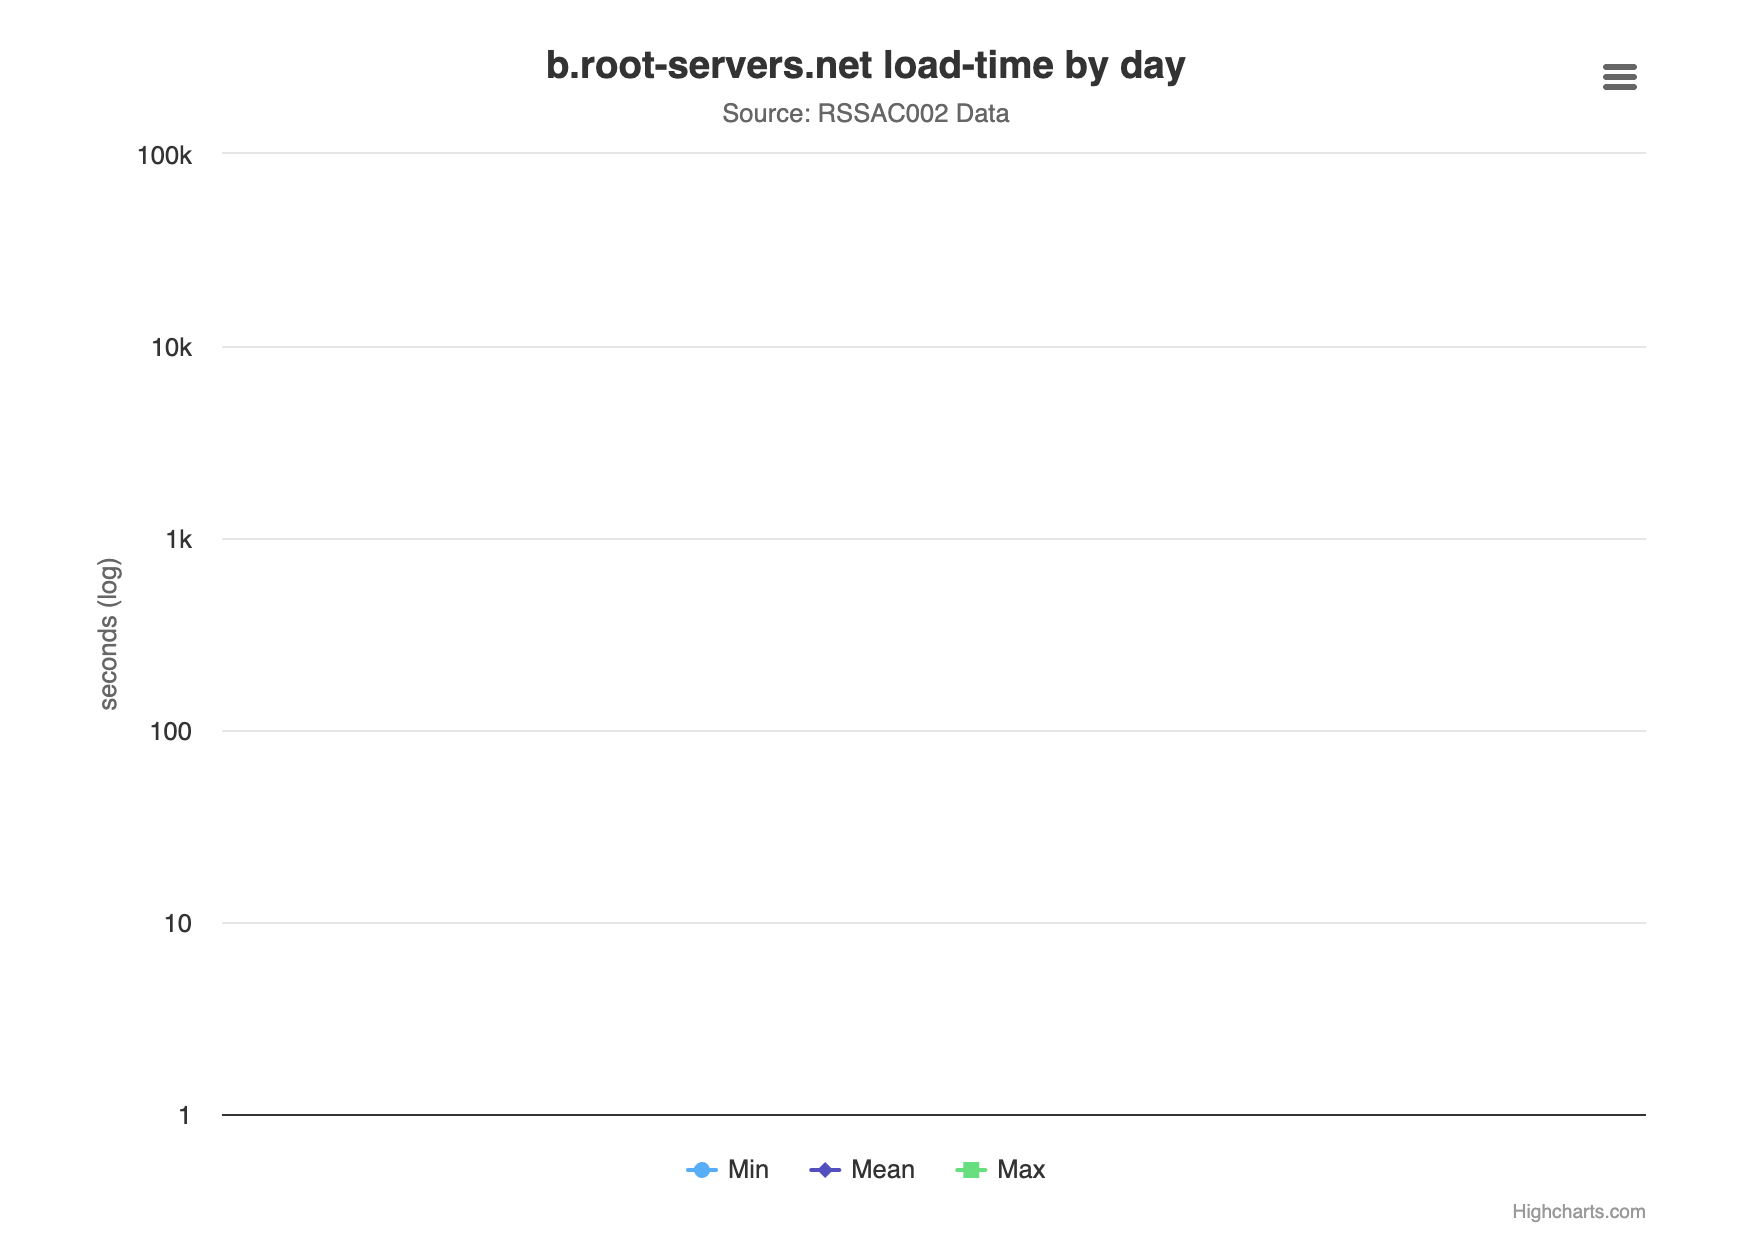
Hi B-root server, FYI, I was checking the load time graph for b.root-server but found it broken. https://rssac002.root-servers.org/load_rsi.html [image: image.png] Kind Regards *Hafiz Farooq* [image: https://www.linkedin.com/in/hmfarooq/] <https://www.linkedin.com/in/hmfarooq/> On Tue, Nov 14, 2023 at 12:27 AM Colin Petrie <colin@spakka.net> wrote:
If you go to:
https://root-servers.org/archives/
You can see the archives per-day from each root server operator.
Each YAML/JSON file contains details about all the published instances of each operator on that day.
I'm not aware of an existing nice graph but the data is there if you wish to generate such a graph.
Kind regards, Colin Petrie
On 13-11-2023 21:41, Yazid M. AKANHO wrote:
Dear RSSAC Caucus,
The https://root-servers.org/ <https://root-servers.org/> shows, for the current day and time (UTC), the total number of instances that compose the root server system. Is there any resource available that shows this number for a particular day in the past ? More specifically, let's say a graph showing the historical evolution of instances count in the rss over time, for example.
If such does not exist, will this require first an update of RSSAC002 before make such graph available ? On the same web site (mentioned above), we can see for each RSO the number of sites for the identity they manage, and a clic on a specific site gives the number of instance for that site. However, there is no data directly showing the number of instances for each RSI at once.this
In case the subject had already been discussed, my apologies for raising again.
-- Prenez soin de vous car chaque jour est une vie. Yazid Akanho Tel: +229 97979910.
_______________________________________________ rssac-caucus mailing list rssac-caucus@icann.org https://mm.icann.org/mailman/listinfo/rssac-caucus
_______________________________________________ By submitting your personal data, you consent to the processing of your personal data for purposes of subscribing to this mailing list accordance with the ICANN Privacy Policy (https://www.icann.org/privacy/policy) and the website Terms of Service (https://www.icann.org/privacy/tos). You can visit the Mailman link above to change your membership status or configuration, including unsubscribing, setting digest-style delivery or disabling delivery altogether (e.g., for a vacation), and so on.
rssac-caucus mailing list rssac-caucus@icann.org https://mm.icann.org/mailman/listinfo/rssac-caucus
_______________________________________________ By submitting your personal data, you consent to the processing of your personal data for purposes of subscribing to this mailing list accordance with the ICANN Privacy Policy (https://www.icann.org/privacy/policy) and the website Terms of Service (https://www.icann.org/privacy/tos). You can visit the Mailman link above to change your membership status or configuration, including unsubscribing, setting digest-style delivery or disabling delivery altogether (e.g., for a vacation), and so on.

Hi Hafiz, Thanks, I'll look into it. Regards, Robert On Tue 2023-11-14 11:53:31+0300 Hafiz wrote:
Hi B-root server,
FYI, I was checking the load time graph for b.root-server but found it broken.
https://rssac002.root-servers.org/load_rsi.html
[image: image.png] Kind Regards *Hafiz Farooq*
-- USC Information Sciences Institute <http://www.isi.edu/> Networking and Cybersecurity Division

Hi Hafiz,
FYI, I was checking the load time graph for b.root-server but found it broken.
Sorry about the delay in getting back to you. We were rather busy with making sure our recent address change went smoothly. I've looked into why we stopped publishing load-time's, and indeed we haven't in a while (long story about that section of our data processing pipeline stopping). We have a fix nearly in place and we should back-create as much of the data as we can so the graphs should hopefully reappear shortly. We'll note that the load-time metric is not one that we believe is all that useful, except when things go really-really wrong (at which point it's probably not the metric that will warn people about the problem). I am curious whether or not anyone actually finds this metric useful, and if so how? In the past we've talked about removing it from RSSAC002 data requirements in the a future version of the specification unless there is a demonstrated need for it (my/our personal opinion, not necessarily the opinion of the other operators). We do intend to support it while it's in the specification though. Cheers, -- Wes Hardaker USC/ISI
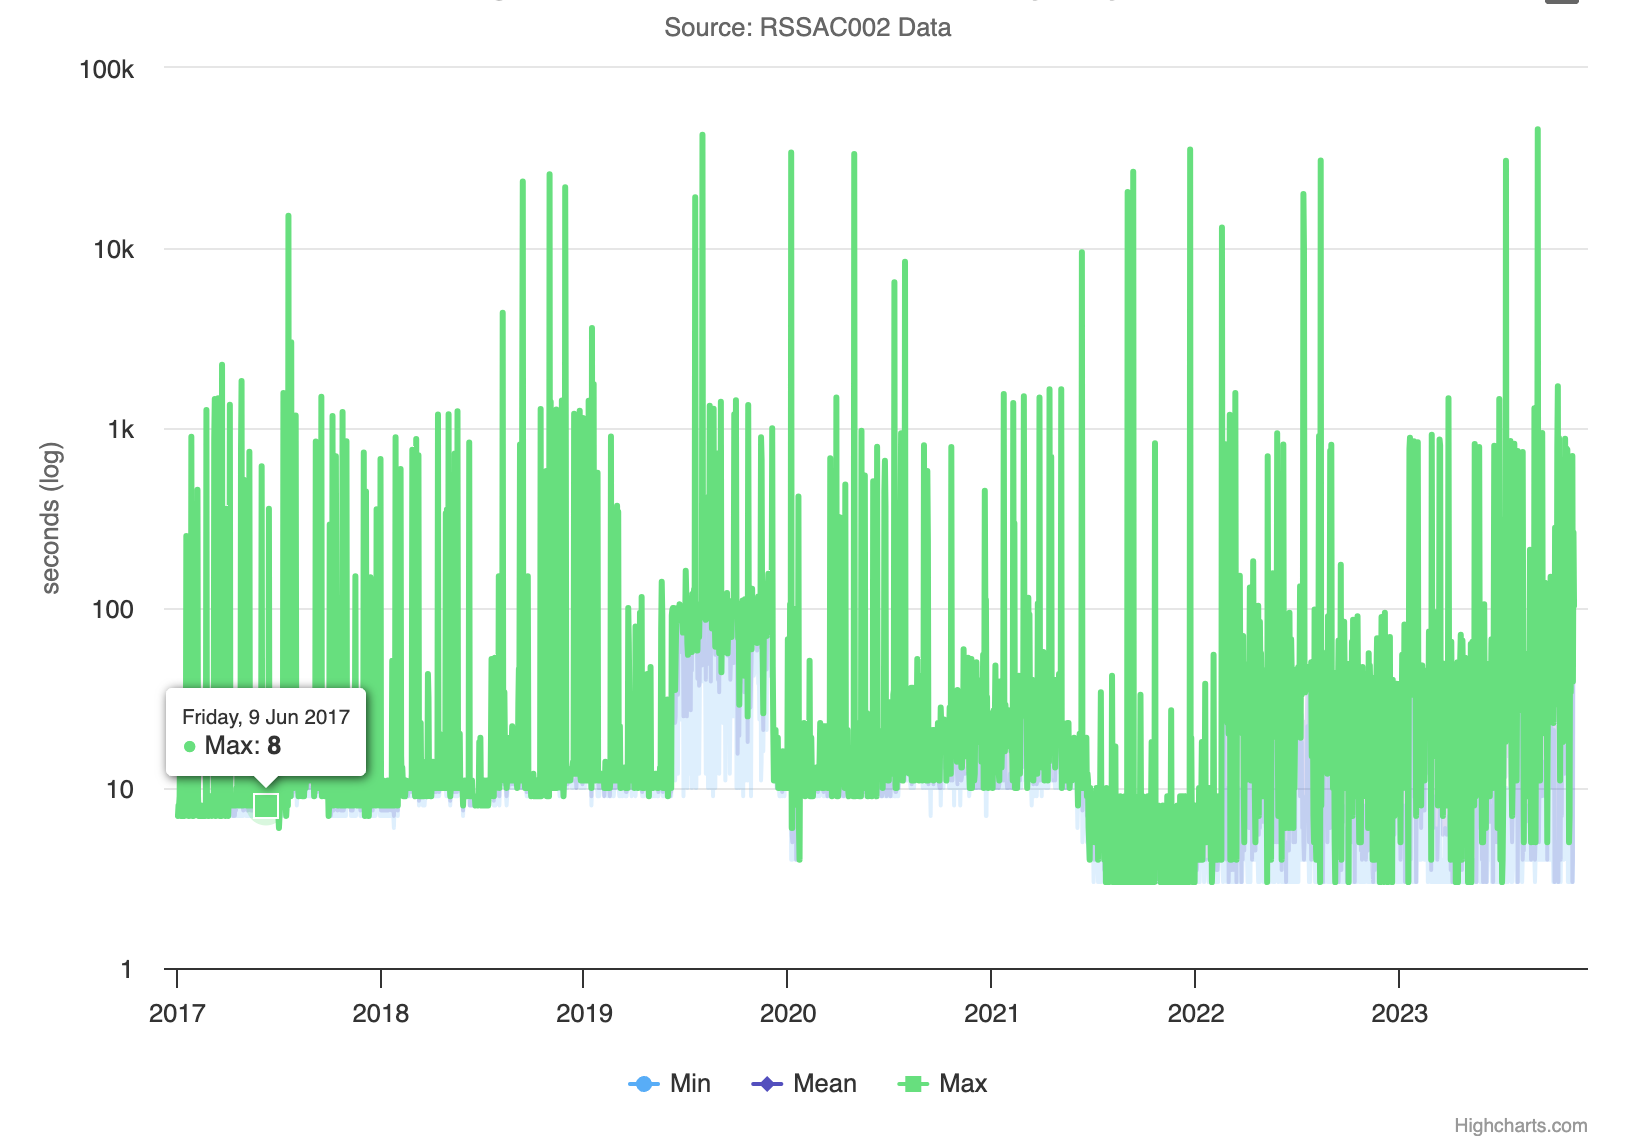
Hi Wes, Thanks for your response, I also tend to agree with having a more reliable parameter for zone-data publishing than the "load-time". I reviewed other load-time graphs and I believe the regular (green) spikes in this parameter probably don't indicate any potential problem. So in my opinion, future rssac002 reviews/versions could look for more indicative stats than the load-time. [image: image.png] Kind Regards *Hafiz Farooq* [image: https://www.linkedin.com/in/hmfarooq/] <https://www.linkedin.com/in/hmfarooq/> On Thu, Nov 30, 2023 at 2:15 AM Wes Hardaker <hardaker@isi.edu> wrote:
Hi Hafiz,
FYI, I was checking the load time graph for b.root-server but found it broken.
Sorry about the delay in getting back to you. We were rather busy with making sure our recent address change went smoothly.
I've looked into why we stopped publishing load-time's, and indeed we haven't in a while (long story about that section of our data processing pipeline stopping). We have a fix nearly in place and we should back-create as much of the data as we can so the graphs should hopefully reappear shortly.
We'll note that the load-time metric is not one that we believe is all that useful, except when things go really-really wrong (at which point it's probably not the metric that will warn people about the problem). I am curious whether or not anyone actually finds this metric useful, and if so how? In the past we've talked about removing it from RSSAC002 data requirements in the a future version of the specification unless there is a demonstrated need for it (my/our personal opinion, not necessarily the opinion of the other operators). We do intend to support it while it's in the specification though.
Cheers, -- Wes Hardaker USC/ISI

Hi, On 11/30/23 20:55, Hafiz Farooq wrote:
I also tend to agree with having a more reliable parameter for zone-data publishing than the "load-time". I reviewed other load-time graphs and I believe the regular (green) spikes in this parameter probably don't indicate any potential problem.
While that may be true, I'm curious whether it's known why the load times vary across three orders of magnitude? Thanks, Peter
So in my opinion, future rssac002 reviews/versions could look for more indicative stats than the load-time.
image.png
Kind Regards *Hafiz Farooq*
https://www.linkedin.com/in/hmfarooq/ <https://www.linkedin.com/in/hmfarooq/>
On Thu, Nov 30, 2023 at 2:15 AM Wes Hardaker <hardaker@isi.edu <mailto:hardaker@isi.edu>> wrote:
Hi Hafiz,
FYI, I was checking the load time graph for b.root-server but found it broken.
Sorry about the delay in getting back to you. We were rather busy with making sure our recent address change went smoothly.
I've looked into why we stopped publishing load-time's, and indeed we haven't in a while (long story about that section of our data processing pipeline stopping). We have a fix nearly in place and we should back-create as much of the data as we can so the graphs should hopefully reappear shortly.
We'll note that the load-time metric is not one that we believe is all that useful, except when things go really-really wrong (at which point it's probably not the metric that will warn people about the problem). I am curious whether or not anyone actually finds this metric useful, and if so how? In the past we've talked about removing it from RSSAC002 data requirements in the a future version of the specification unless there is a demonstrated need for it (my/our personal opinion, not necessarily the opinion of the other operators). We do intend to support it while it's in the specification though.
Cheers, -- Wes Hardaker USC/ISI
_______________________________________________ rssac-caucus mailing list rssac-caucus@icann.org https://mm.icann.org/mailman/listinfo/rssac-caucus
_______________________________________________ By submitting your personal data, you consent to the processing of your personal data for purposes of subscribing to this mailing list accordance with the ICANN Privacy Policy (https://www.icann.org/privacy/policy) and the website Terms of Service (https://www.icann.org/privacy/tos). You can visit the Mailman link above to change your membership status or configuration, including unsubscribing, setting digest-style delivery or disabling delivery altogether (e.g., for a vacation), and so on.
-- Like our community service? 💛 Please consider donating at https://desec.io/ deSEC e.V. Kyffhäuserstr. 5 10781 Berlin Germany Vorstandsvorsitz: Nils Wisiol Registergericht: AG Berlin (Charlottenburg) VR 37525
While that may be true, I'm curious whether it's known why the load times vary across three orders of magnitude?
I can only offer speculations based on our own deployment architectures, but it should serve as an example of why these measurements are somewhat meaningless in the first place. Consider a set of systems that are all on SOA-1. Now, take one of those systems out of the current processing load because it needs an OS update while the rest continue handling the load. A second later, the rest of the systems upgrade to SOA-2. A long time later the OS upgrade gets finished, it gets rebooted and the name server comes on line and logs that it now has SOA-2. This could easily be order hours later given the length of an OS upgrade and will affect the maximum time seen quite severely. You can likely start thinking of much more challenging scenarios like systems that are entirely off for a hardware replacement, or network connectivity fix, etc that could easily sneak into order days of delay in getting a new SOA. This delay does not matter though, as none of these "down" systems would be actually answering queries yet so there is no harm in the actual delay that is being reported. Many many more scenarios are likely as well, of course. Routing outages that cause no user degradations can technically cause reported load-time slips, for example. -- Wes Hardaker USC/ISI
On 12/14/23 17:48, Wes Hardaker wrote:
While that may be true, I'm curious whether it's known why the load times vary across three orders of magnitude?
I can only offer speculations based on our own deployment architectures, but it should serve as an example of why these measurements are somewhat meaningless in the first place.
Thanks. -- Your example of a machine that's taken out of service for maintenance, and will then yield a long load-time metric for the next serial makes total sense, and of course does not indicate a problem. Nevertheless, I wouldn't say that that's a meaningless metric. In indicates the typical quantiles for zone propagation times, which is a good piece of data to be floating. (If this were removed, this may lead to less realistic assumptions of propagation times a few years later.) Best, Peter -- https://desec.io/

On 14 Dec 2023, at 16:49, Wes Hardaker <hardaker@isi.edu> wrote:
This delay does not matter though, as none of these "down" systems would be actually answering queries yet so there is no harm in the actual delay that is being reported.
This perhaps suggests that the report itself from such an anycast node is extraneous and could or should be suppressed. The goal is presumably to measure the propagation time for changes in the root zone to edge elements that answer queries while updates propagate. Your examples are not those. Joe
On Wed, Nov 29, 2023 at 3:14 PM Wes Hardaker <hardaker@isi.edu> wrote:
Hi Hafiz,
FYI, I was checking the load time graph for b.root-server but found it broken.
Sorry about the delay in getting back to you. We were rather busy with making sure our recent address change went smoothly.
Hi Hafiz, As an FYI we've backprogegated our load-time data for as far back as I'm willing to go without sacrificing accuracy (though the sacrifice would likely be order seconds if I went further). I've been waiting for the graph to update before saying "fixed" but I note that we now appear on the load-time graphs again as of yesterday-ish. -- Wes Hardaker USC/ISI
Hi Wes, Thanks for the update. I can see the data being updated now. Kind Regards *Hafiz Farooq* [image: https://www.linkedin.com/in/hmfarooq/] <https://www.linkedin.com/in/hmfarooq/> On Thu, Dec 14, 2023 at 7:42 PM Wes Hardaker <hardaker@isi.edu> wrote:
On Wed, Nov 29, 2023 at 3:14 PM Wes Hardaker <hardaker@isi.edu> wrote:
Hi Hafiz,
FYI, I was checking the load time graph for b.root-server but found it broken.
Sorry about the delay in getting back to you. We were rather busy with making sure our recent address change went smoothly.
Hi Hafiz,
As an FYI we've backprogegated our load-time data for as far back as I'm willing to go without sacrificing accuracy (though the sacrifice would likely be order seconds if I went further). I've been waiting for the graph to update before saying "fixed" but I note that we now appear on the load-time graphs again as of yesterday-ish.
-- Wes Hardaker USC/ISI
Thanks, Colin. -- Prenez soin de vous car chaque jour est une vie. Yazid Akanho Tel: +229 97979910. Le lun. 13 nov. 2023, 13:27, Colin Petrie <colin@spakka.net> a écrit :
If you go to:
https://root-servers.org/archives/
You can see the archives per-day from each root server operator.
Each YAML/JSON file contains details about all the published instances of each operator on that day.
I'm not aware of an existing nice graph but the data is there if you wish to generate such a graph.
Kind regards, Colin Petrie
On 13-11-2023 21:41, Yazid M. AKANHO wrote:
Dear RSSAC Caucus,
The https://root-servers.org/ <https://root-servers.org/> shows, for the current day and time (UTC), the total number of instances that compose the root server system. Is there any resource available that shows this number for a particular day in the past ? More specifically, let's say a graph showing the historical evolution of instances count in the rss over time, for example.
If such does not exist, will this require first an update of RSSAC002 before make such graph available ? On the same web site (mentioned above), we can see for each RSO the number of sites for the identity they manage, and a clic on a specific site gives the number of instance for that site. However, there is no data directly showing the number of instances for each RSI at once.this
In case the subject had already been discussed, my apologies for raising again.
-- Prenez soin de vous car chaque jour est une vie. Yazid Akanho Tel: +229 97979910.
_______________________________________________ rssac-caucus mailing list rssac-caucus@icann.org https://mm.icann.org/mailman/listinfo/rssac-caucus
_______________________________________________ By submitting your personal data, you consent to the processing of your personal data for purposes of subscribing to this mailing list accordance with the ICANN Privacy Policy (https://www.icann.org/privacy/policy) and the website Terms of Service (https://www.icann.org/privacy/tos). You can visit the Mailman link above to change your membership status or configuration, including unsubscribing, setting digest-style delivery or disabling delivery altogether (e.g., for a vacation), and so on.
rssac-caucus mailing list rssac-caucus@icann.org https://mm.icann.org/mailman/listinfo/rssac-caucus
_______________________________________________ By submitting your personal data, you consent to the processing of your personal data for purposes of subscribing to this mailing list accordance with the ICANN Privacy Policy (https://www.icann.org/privacy/policy) and the website Terms of Service (https://www.icann.org/privacy/tos). You can visit the Mailman link above to change your membership status or configuration, including unsubscribing, setting digest-style delivery or disabling delivery altogether (e.g., for a vacation), and so on.
participants (7)
-
 Colin Petrie
 -
 Hafiz Farooq
 -
 Joe Abley
 -
 Peter Thomassen
 -
 Robert Story
 -
 Wes Hardaker
 -
 Yazid M. AKANHO