
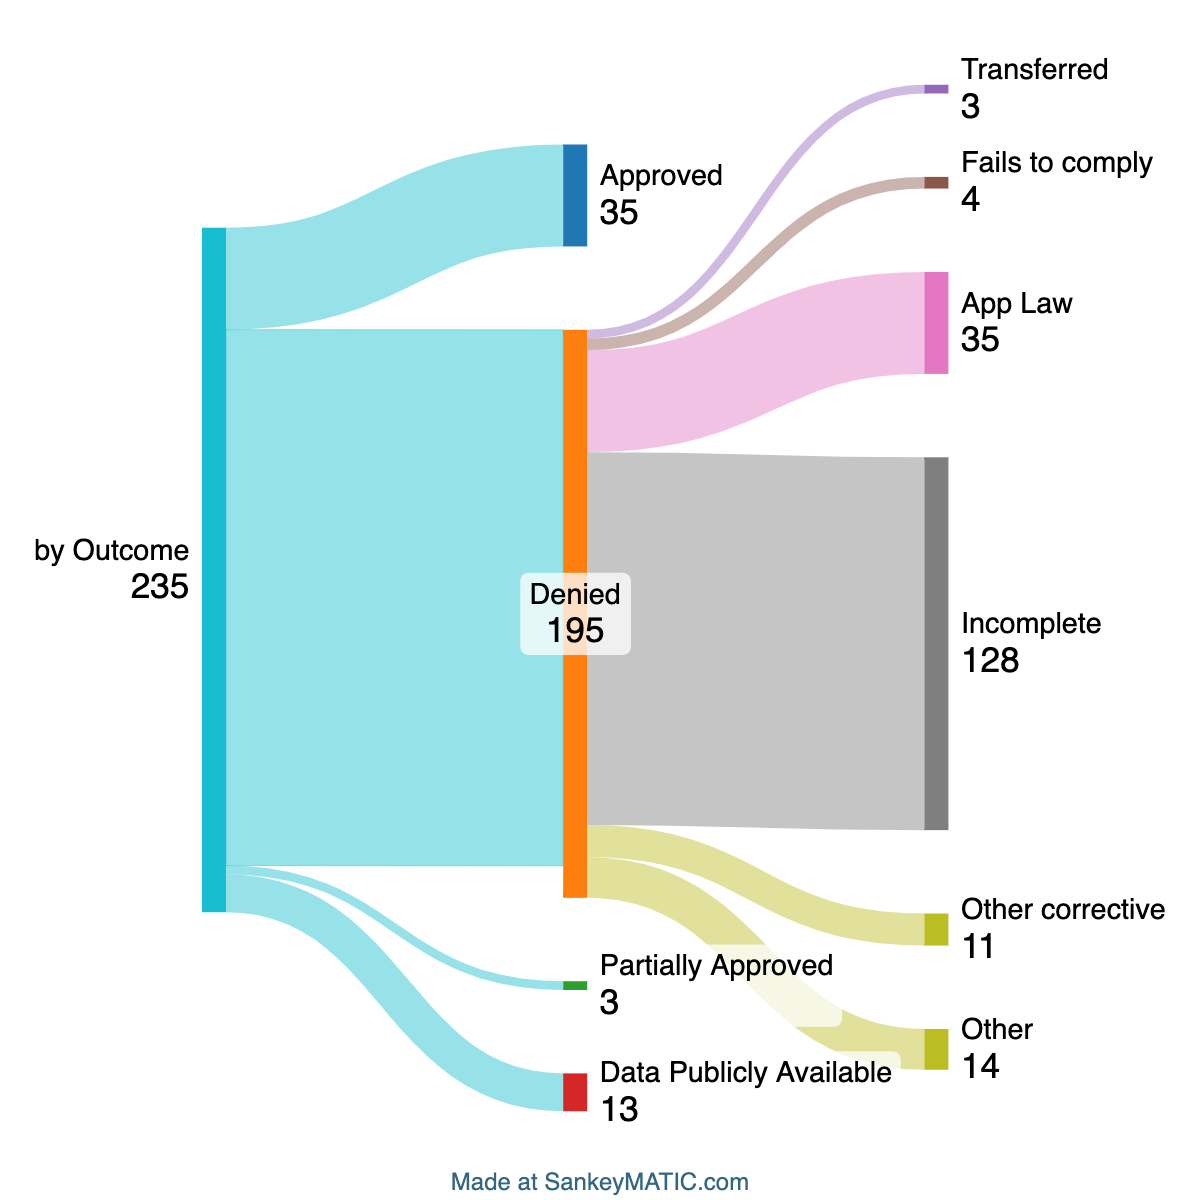
Dear Standing Committee and Team, Attached are my first 2 attempts are representing our data using Gab’s Sankey tool. * Columns A to D is the report as shared by Staff * Column E is my take at synthetising labels to better fit the graphs * Columns F to P is the graph data to copy/paste into the Sankey online tool: https://sankeymatic.com/build/ Each box is a single graph’s data set paired in current and total data. For example to generate the below: [A diagram of a diagram Description automatically generated] Copy the content of O27:O38 and paste it in the “Inputs:” window of the Sankey tool (removing and replacing the default content). Before we look at automate the generation of graphs, can I ask the group to try and test the ones I prepared and see what is and isn’t relevant. Kindly, Sebastien Ducos GoDaddy Registry | Senior Client Services Manager [signature_1754391585] +33612284445 France & Australia sebastien@registry.godaddy<mailto:sebastien@registry.godaddy> From: Lisa Carter via Gnso-rdrs-sc <gnso-rdrs-sc@icann.org> Date: Wednesday, 15 May 2024 at 4:00 PM To: gnso-rdrs-sc@icann.org <gnso-rdrs-sc@icann.org> Subject: [Gnso-rdrs-sc] Re: The April RDRS Usage Metrics report is published. Caution: This email is from an external sender. Please do not click links or open attachments unless you recognize the sender and know the content is safe. Forward suspicious emails to isitbad@. Hi All, The RDRS Usage Metrics Report<https://www.icann.org/en/system/files/files/rdrs-usage-metrics-15may24-en.pd...> and CSV<https://www.icann.org/en/system/files/files/rdrs-usage-metrics-15may24-en.cs...> for the 1-30 April reporting period have been published to the RDRS page<https://www.icann.org/rdrs-en>. Thanks Lisa Carter Sr. Program Manager, Strategic Initiatives ICANN [signature_2495464456]