
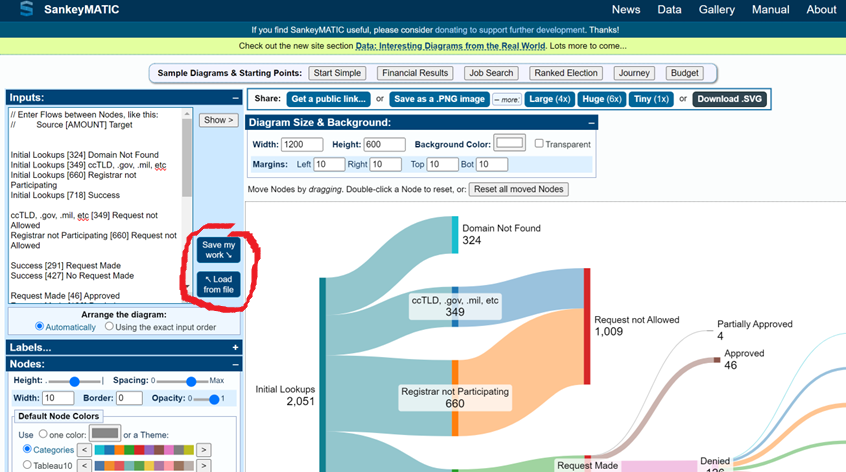
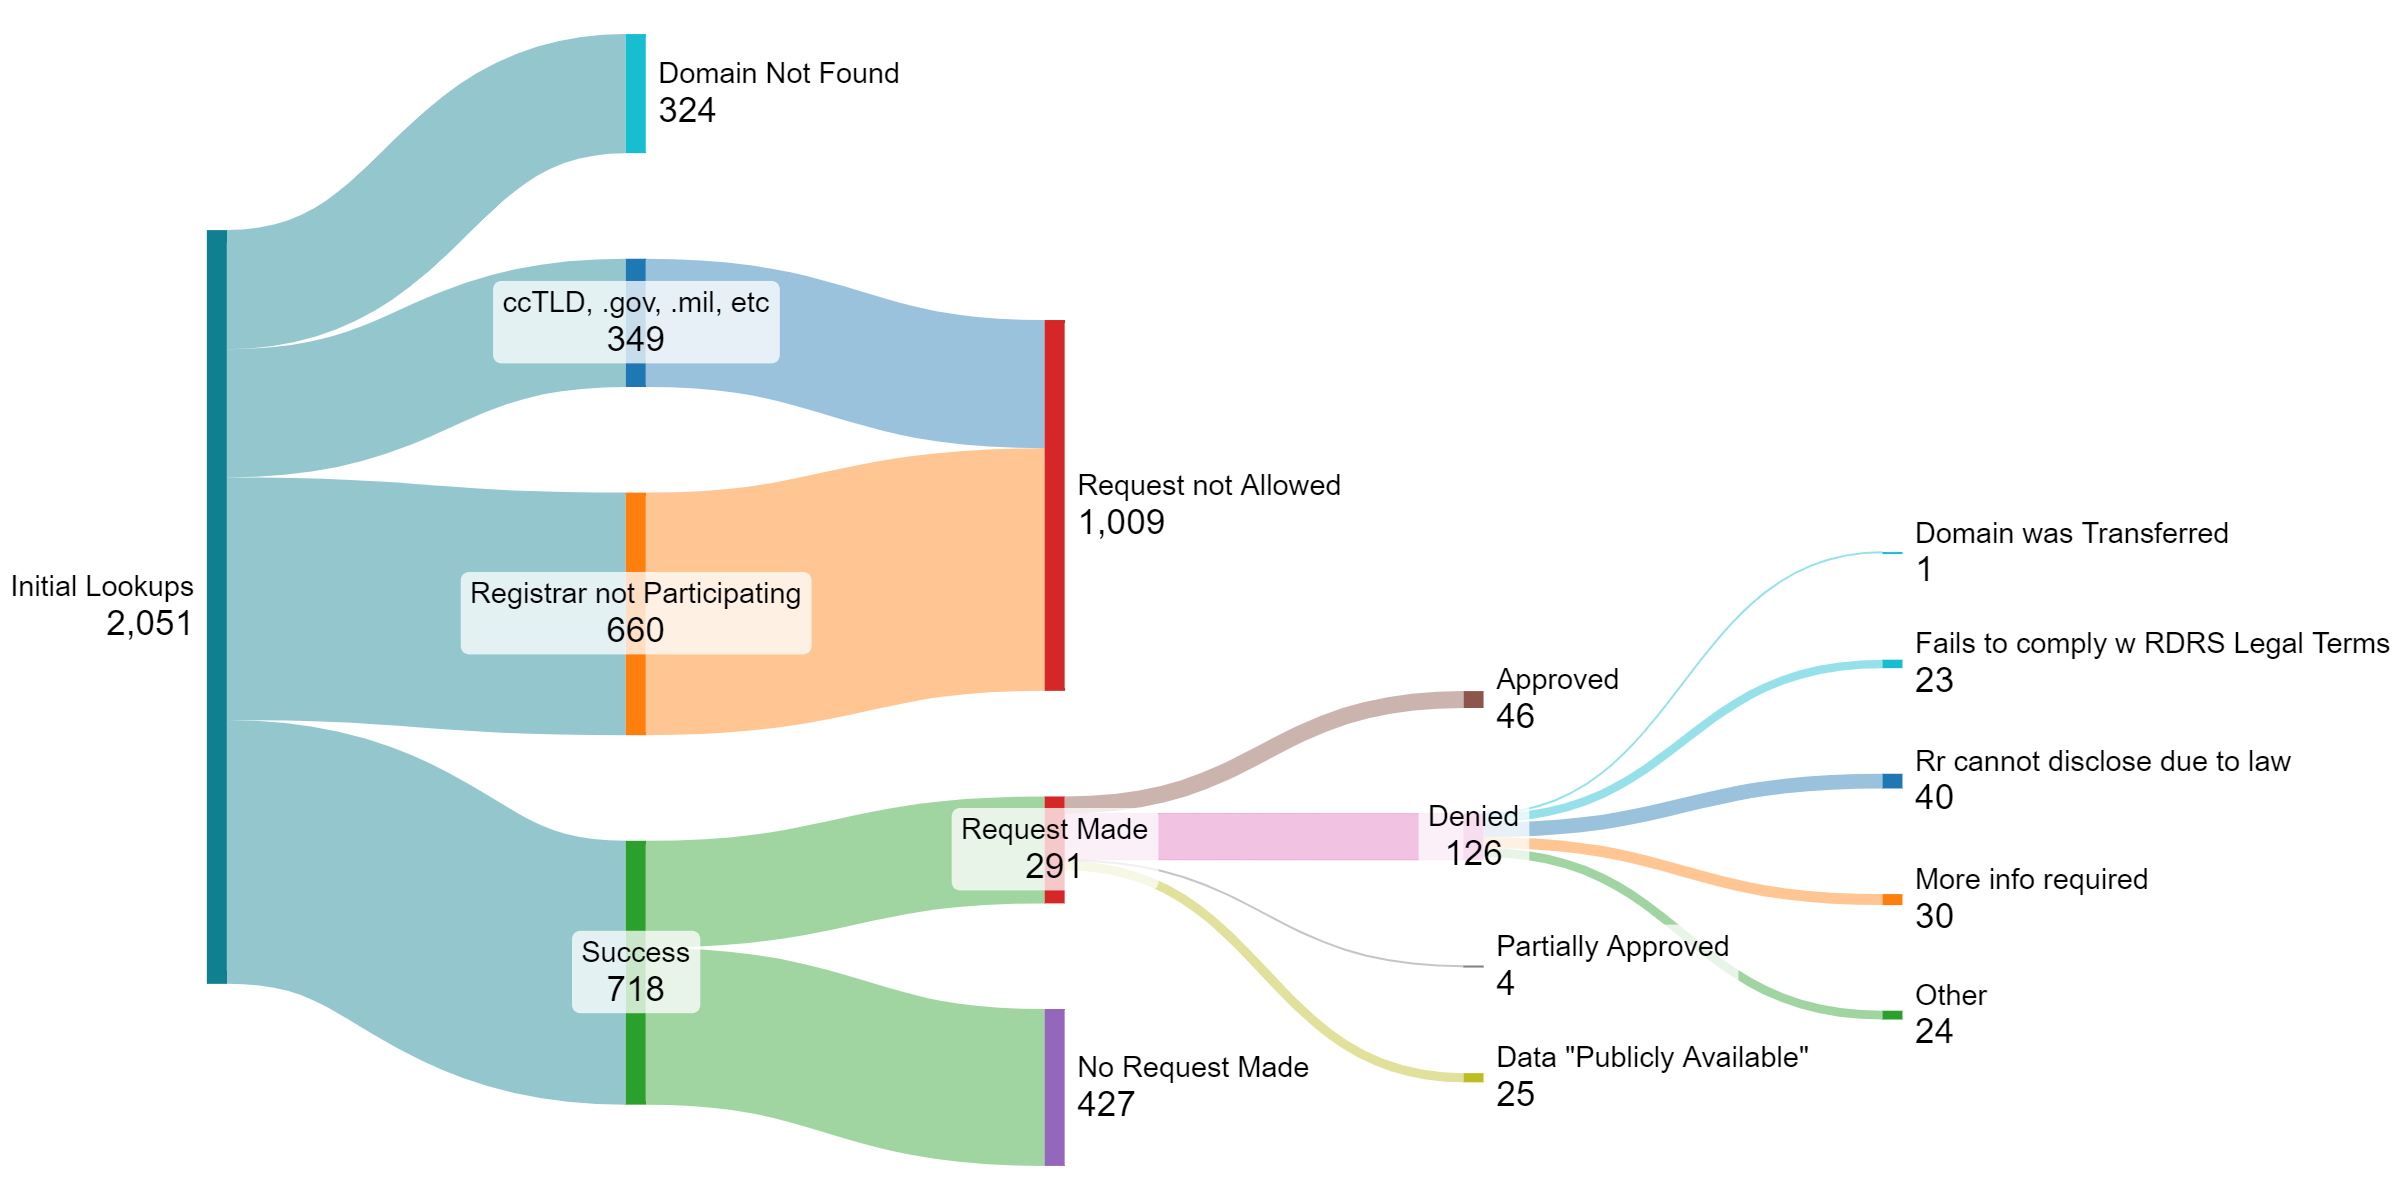
Hi folks – Some on the Standing Committee asked me what tool I used to make the Sankey graph I’ve been playing with. If that doesn’t interest you, please feel free to ignore anything further, as that’s all I’m talking about here 😊 The short answer is: https://sankeymatic.com/ . It’s a free tool created by Steve Bogart, with a great web GUI, and additional source code resources on GitHub. It’s one of many such tools out there, and just happens to be the one I’ve found to be most user friendly. The slightly longer answer is: I took the numbers from ICANN’s January metrics report<https://www.icann.org/en/system/files/files/rdrs-usage-metrics-16feb24-en.pd...>, making some small inferences (such as taking Metric 10 and converting %s to #s, which necessarily introduces minor inaccuracy), and input them into the text format that sankeymatic prefers. Text file attached. You can “Load from file”, select this text file, and play with the chart yourself, or make similar. It’s fun. [cid:image001.png@01DA6FB5.6F912D80] That said – I’ve made a lot of transcriptions by hand, and that means I might make transcription errors. It’d be great to minimize the risk of such errors, and to that end I’ve asked our helpful ICANN staff if we might be able to get .csv (or similar) files of the data they put into the metrics reports. Much easier to copy/paste from a .csv than from the document format. They advised they’re going to see if its possible, and if it is, will share not just with me but with all of us. (Thank you staff!) Hope that answered the questions I’ve been getting, and further hope that my fellow nerds might find it fun (or useful). =) Thanks/cheers, Gabriel